

MemTrack
AvailableNormalised performance monitoring for RO, UF and MBR plants, with automated health checks and daily reports.
Overview
MemTrack takes operating data from SCADA, a data logger or manual entry, normalises it, and trends membrane performance by train and stage (RO), rack (UF) or stack (MBR). It compares each one against your baseline and flags the ones that need attention, without false alarms after every clean.
Who it's for: Operators, process engineers and asset owners running RO, UF or MBR plants who need to see fouling, scaling or membrane damage early and plan CIPs and replacements from data.
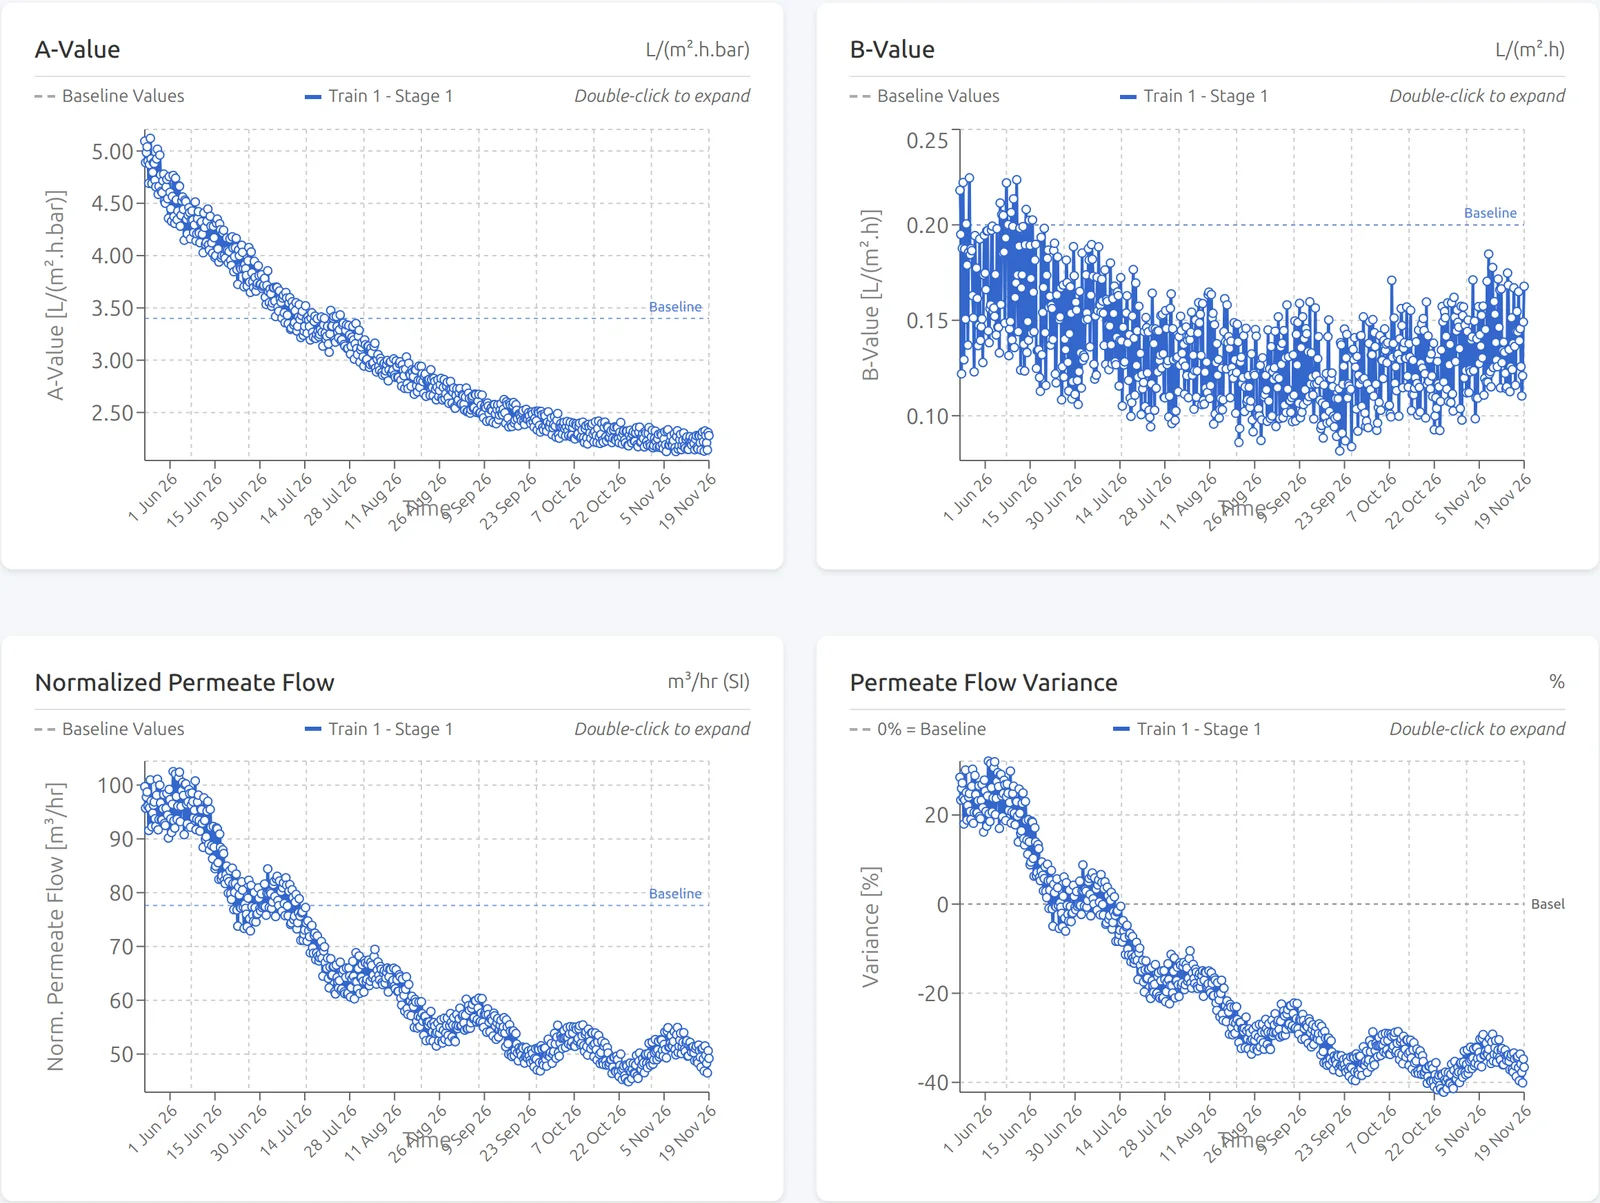
Normalised metrics
- RO: normalised permeate flow, normalised differential pressure, normalised salt passage, A-value (water permeability), B-value (salt transport), pressure differential coefficient and stage flux.
- UF: normalised permeability and TMP, average and maximum flux (net and instantaneous), recovery, turbidity, solids passage and temperature correction.
- MBR: normalised permeability and TMP, flux, flow, aeration demand, temperature and water level.
Health analysis
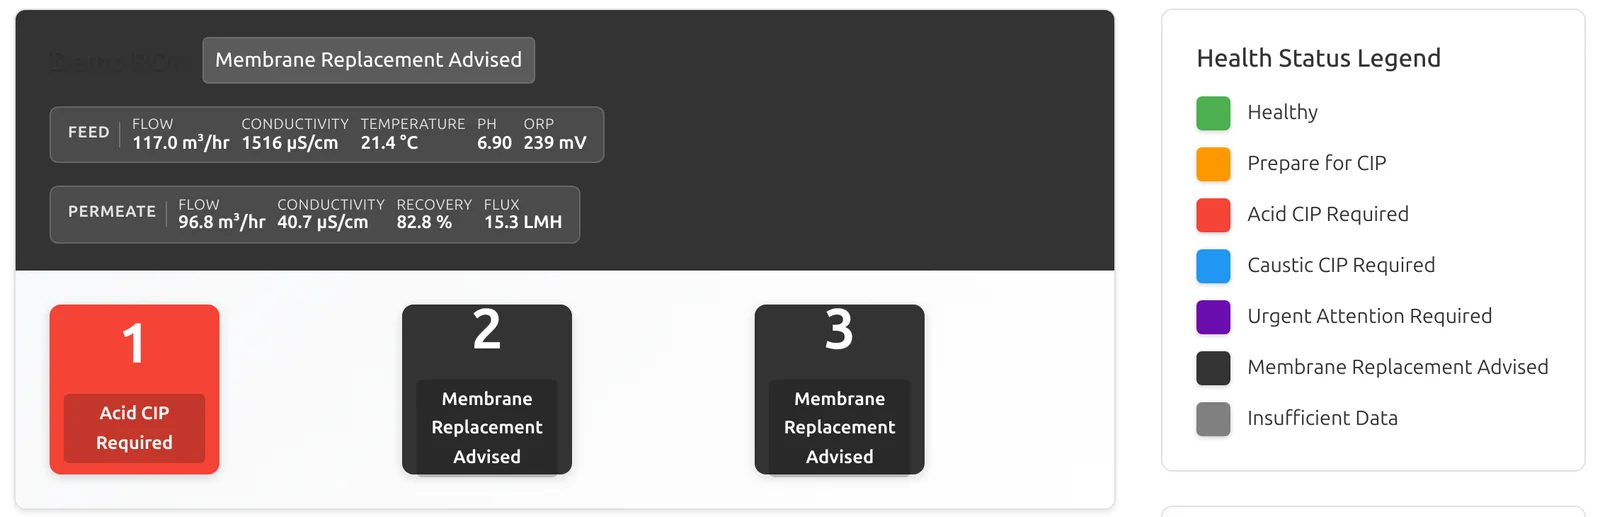
- Health maps for every stage, rack or stack against the baseline you set, using mean, median or 90th percentile over a lookback period you choose.
- Recovery detection: a CIP or membrane replacement shows as a step improvement. MemTrack detects it and starts the lookback window after the event, so pre- and post-clean data aren't mixed into a false unhealthy reading.
- Performance above baseline doesn't raise alerts.
- A ‘prepare for CIP’ reminder 90 days after a recovery event.
- An event log for CIPs, membrane changes and other interventions, recorded against each RO stage.
Data in, reports out
- REST data pipeline for automated uploads from SCADA or loggers, with single-point and bulk ingestion and validation, for RO, UF and MBR.
- In-app API documentation with example scripts, including for eWON gateways.
- Manual data entry for sites without a data link.
- Daily or user-scheduled health-report emails covering RO, UF and MBR status, the last 24 hours of feed and permeate data, and CIP/recovery notices.
- Chart export.
Accounts and security
- Multi-factor authentication: TOTP authenticator apps, WebAuthn passkeys and recovery codes.
- Company accounts with user roles. Each user can choose their own units.
Limitations
What it doesn't do, or does only with conditions.
- Normalisation needs reliable flow, pressure, conductivity and temperature measurements. Drifting instruments show up as drifting performance.
- MemTrack monitors and flags problems. It doesn't change plant setpoints or connect to control systems for writing.
- UF and MBR modules are enabled per account.
Other products